As an independent consultant, I partner with organizations to solve their most complex challenges in machine learning and computational science. I have successfully delivered 30+ projects for a diverse clientele across the United States, Europe, UK, Korea, and India. My approach bridges the gap between deep technical expertise and strategic, end-to-end project management. I focus on translating complex business needs into robust, scalable models and delivering clear, actionable insights for all stakeholders.
Below is a collection of consulting and research projects carried out by Aditya Sengar. Each entry expands to reveal a short technical summary, an illustration and a link placeholder for the corresponding code or report. More information about my professional background and services is available on my Kolabtree profile.
Machine learning projects
Dynamic Multi-Objective Counterfactuals for Credit Risk – generating adaptive, user-centric recourse
To move beyond simple gradient-based explanations, I designed a Dynamic Feature Weight Genetic Algorithm (DFWGA) for credit risk recourse. This model-agnostic, multi-objective solver co-evolves a dual chromosome $c = (\mathbf{v}, \mathbf{w})$, representing both the counterfactual candidate ($\mathbf{v}$) and its adaptive feature weights ($\mathbf{w}$). This allows the search to dynamically learn the most efficient recourse paths by minimizing a weighted distance function that incorporates user-defined costs $\mathbf{p}$:$$d(\mathbf{x}_\mathrm{orig}, \mathbf{c}; \mathbf{w}) = \sum_{i=1}^{m} w_i | x_{\mathrm{orig},i} - c_i | + \sum_{j=1}^{u} w_{m+j} \cdot \mathrm{Match}(x_{\mathrm{orig},m+j}, c_{m+j}) $$Tested on the HMDA dataset, the DFWGA generated valid, plausible recourse options for diverse models (CNN, XGBoost, SVMs). For an MLP, it identified an optimal path to loan approval with an L1 proximity of just 1.024 and a sparsity of 4 feature changes.
Strategic Consulting in AI and Quantum Computing for Oncology – pioneering next-generation drug discovery
This project involved strategic consulting on the application of advanced computational methods in personalized medicine. The work focused on designing a roadmap for integrating Artificial Intelligence into cancer research and exploring the use of Quantum Computing to accelerate drug discovery pipelines. A key technical area was the assessment of hybrid quantum-classical algorithms, such as the Variational Quantum Eigensolver (VQE), for calculating molecular properties with high precision. Beyond the technical research, the engagement included business development for the AI oncology platform, managing legal aspects such as non-disclosure agreements, and overseeing project timelines to deliver a forward-looking strategy for therapeutic development.
Development of a Seq2Seq Chatbot with PyTorch – conversational modelling
Building a human‑like chatbot required training a sequence‑to‑sequence model with attention. The encoder and decoder were implemented with gated recurrent units. At each time step \(t\) the encoder updates its hidden state via \[ h_t = \mathrm{GRU}(x_t, h_{t-1}), \] while the decoder predicts the next token \(y_t\) using an attention‑weighted context vector \(c_t\). Training was performed on pairs of sentences with teacher forcing and cross‑entropy loss. To reduce over‑fitting I used dropout and gradient clipping. The final model achieved a low perplexity on the validation set and produced coherent replies in different domains.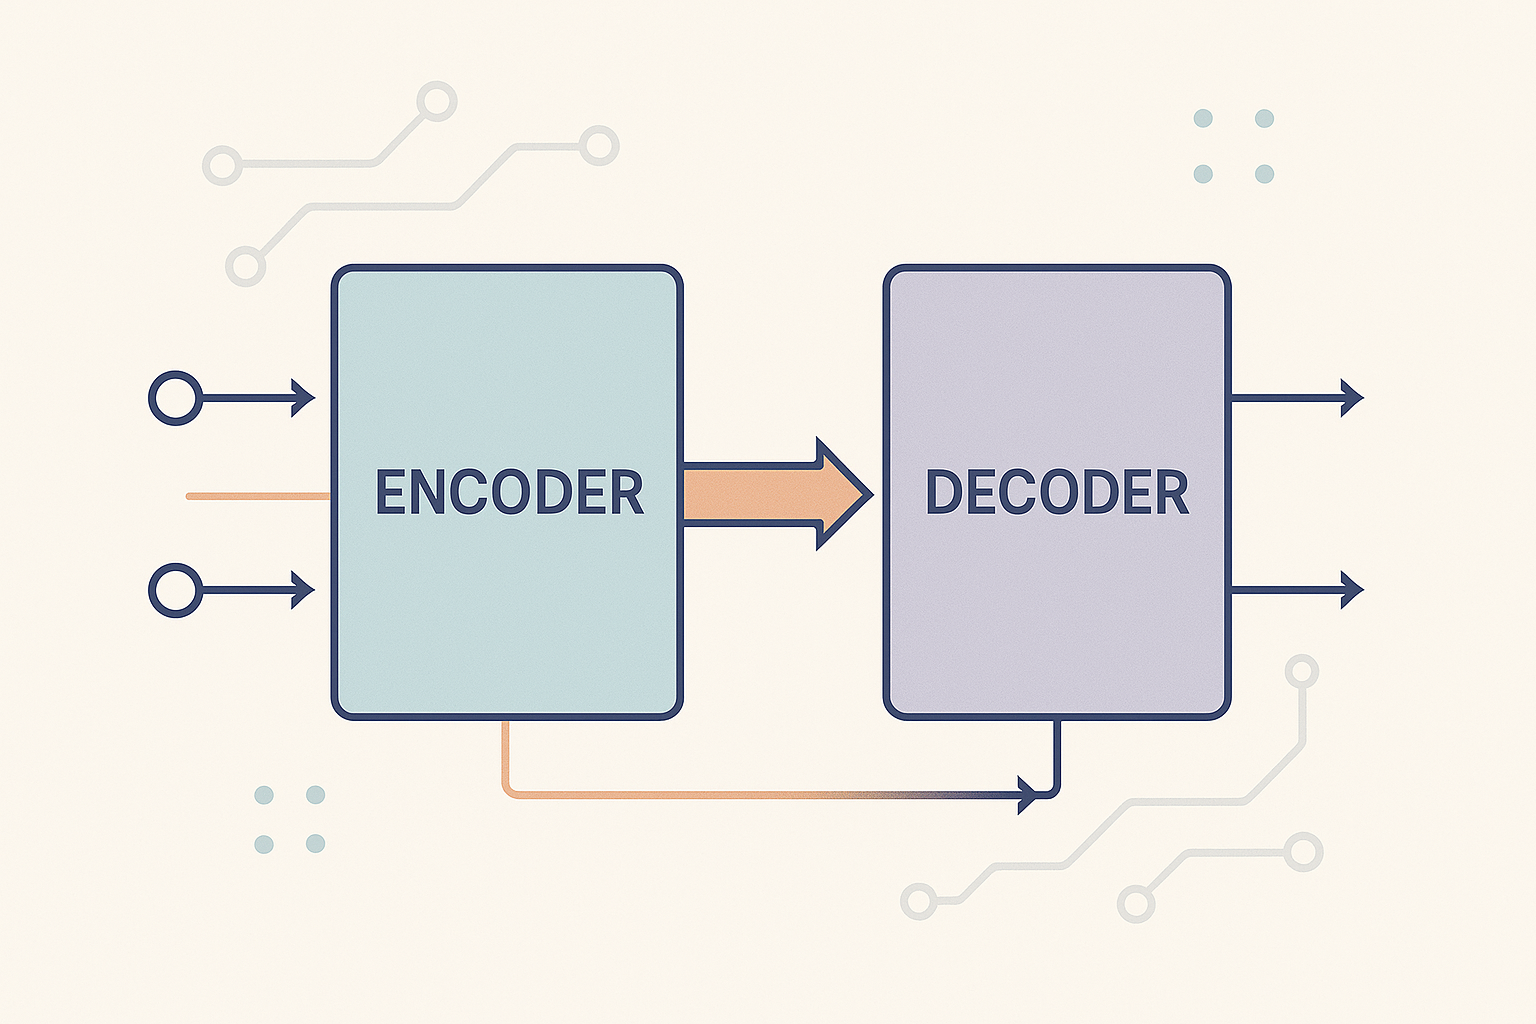
Molecular Solubility prediction using PyTorch Geometric – predicting logS values
Predicting aqueous solubility is essential in drug discovery. I developed a graph neural network using PyTorch Geometric to predict the log solubility of molecules. The model employed message passing layers that aggregate information from neighbouring atoms: \[ h_v^{(k+1)} = \phi\Bigl(h_v^{(k)}, \square_{u\in \mathcal{N}(v)} \psi(h_u^{(k)}, h_v^{(k)}, e_{uv})\Bigr), \] where \(\psi\) is a message function and \(\phi\) an update function. Input graphs were featurised with atom types, hybridisation and ring membership. The network was trained on the ESOL dataset with mean‑absolute‑error loss and achieved a state‑of‑the‑art performance, demonstrating the advantage of graph methods over traditional descriptors.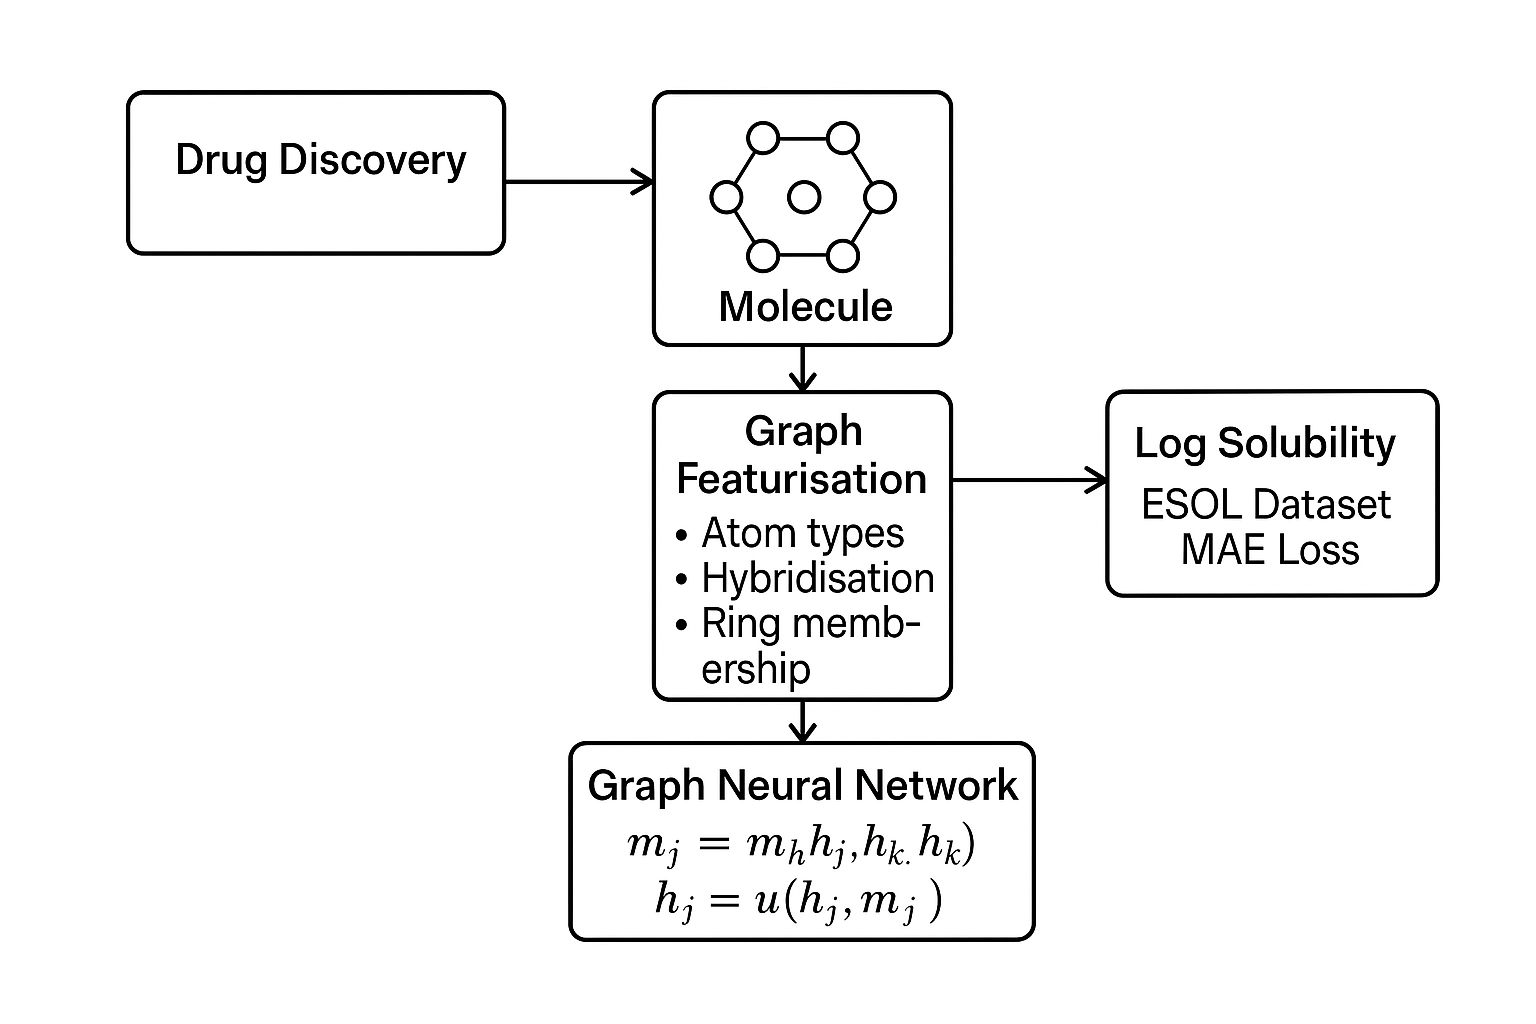
Evolutionary Games and Reinforcement Learning – population dynamics and learning
This simulation studied interactions among humans, robots and AI agents on a two‑dimensional grid. I implemented Hoffman’s evolutionary games where the change in population fraction \(x_i\) of species \(i\) follows the replicator equation \[ \dot{x}_i = x_i \bigl(f_i(\mathbf{x}) - \bar{f}(\mathbf{x})\bigr), \] with \(f_i\) representing the fitness of species \(i\) and \(\bar{f}\) the average fitness. I also implemented a Q‑learning agent with update rule \[ Q(s,a) \leftarrow Q(s,a) + \alpha \bigl[r + \gamma \max_{a'} Q(s',a') - Q(s,a)\bigr], \] where \(r\) is the reward and \(\gamma\) the discount factor. Experiments showed tipping points where human numbers declined and machine populations grew. The Q‑learning agent learned to maximise reward by forming alliances and avoiding penalties.
Machine Learning Models for Anomaly Detection in API Security – detecting misuse
Protecting APIs requires identifying unusual patterns in request streams. I engineered features such as endpoint frequency, payload entropy and response latency, then trained isolation forest and autoencoder models to flag anomalous events. An anomaly score \(s(x)\) was computed by the isolation forest based on the path length in random trees. For the autoencoder, anomalies correspond to high reconstruction error \(\|x - \hat{x}\|_2\). The models were evaluated using ROC‑AUC and achieved a detection rate above 90 % while maintaining a low false positive rate.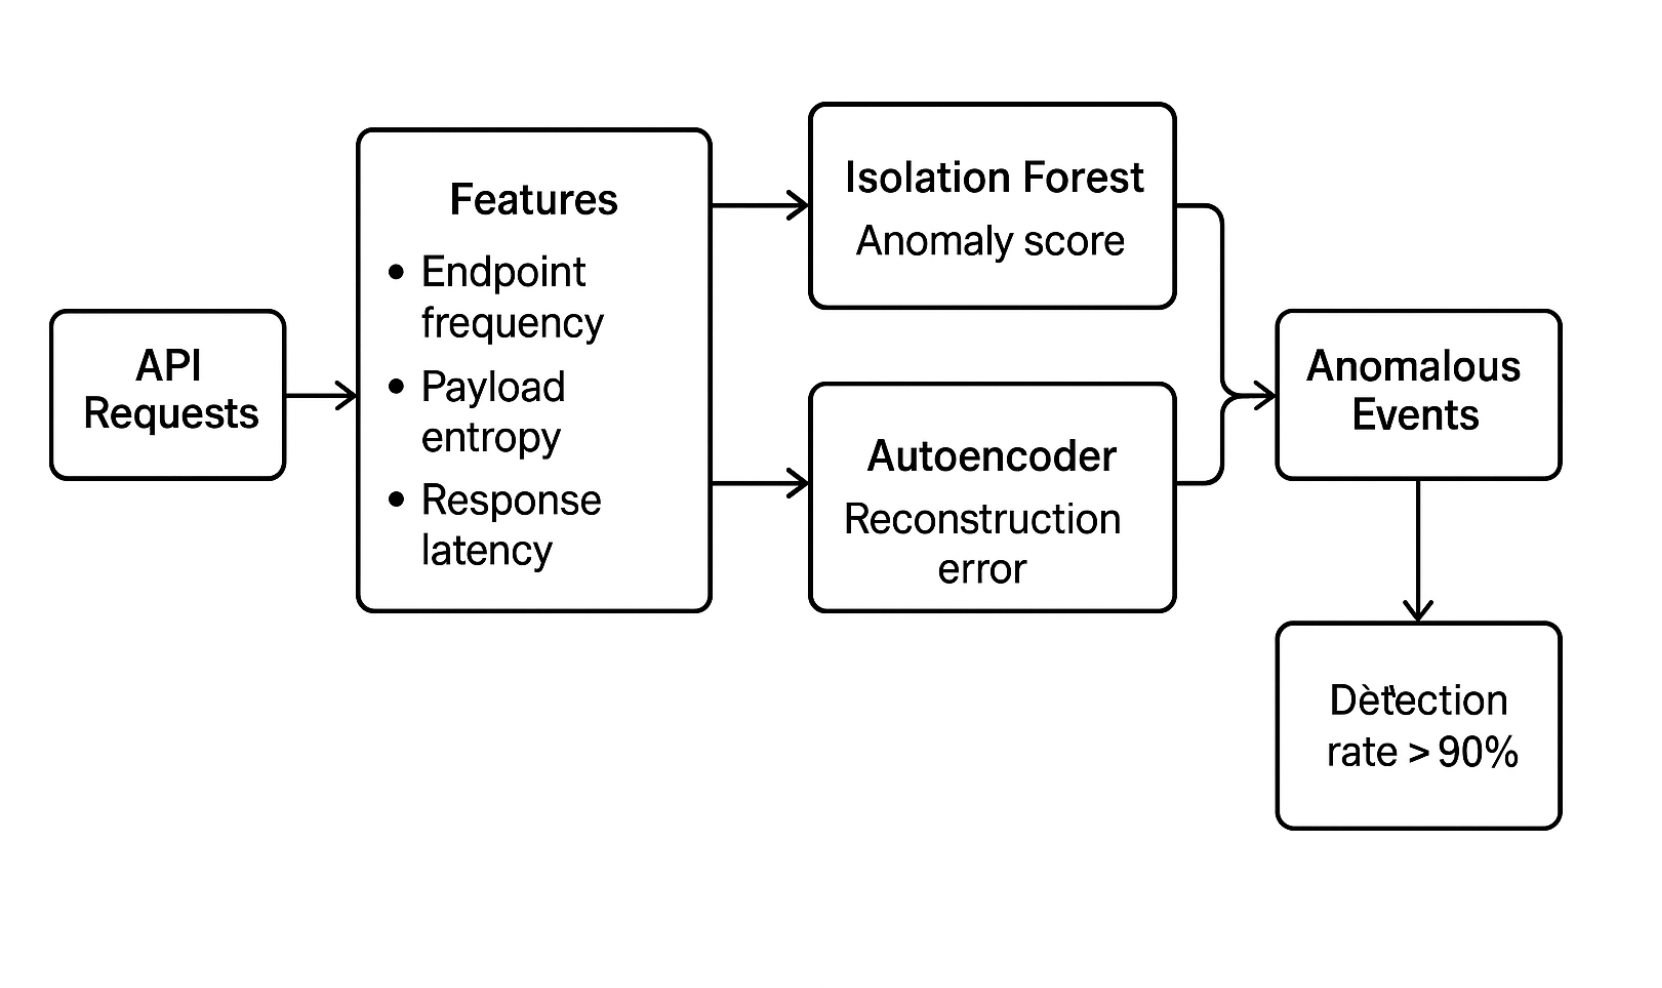
Predictive Analysis of Football Match Outcomes – modelling goals and results
To forecast football match results, I built a Poisson regression model to estimate goal counts for home and away teams. The expected goals for a team were modelled as \[ \lambda = \exp(\beta_0 + \beta_1\,\text{attack strength} + \beta_2\,\text{defence weakness}), \] and the probability of a scoreline \((k,\ell)\) was given by the product of two independent Poisson distributions. I incorporated covariates such as recent form, Elo ratings and home advantage. Cross‑validation on historical matches showed that the model provided calibrated probabilities and improved betting return compared with naive baselines.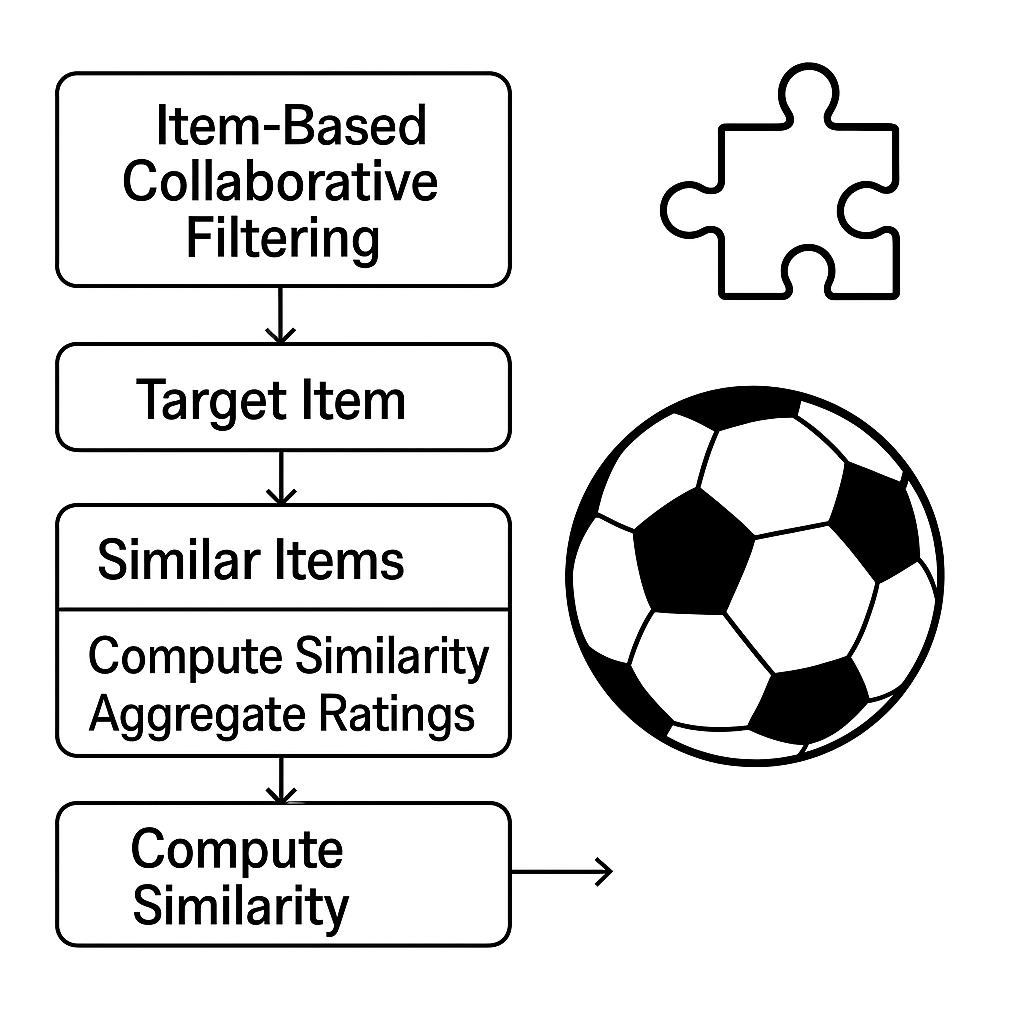
A Quantitative analysis of Forex and Silver Markets – exploring correlation
This study examined the relationship between currency pairs (e.g., EUR/USD) and silver prices. I used time series techniques such as augmented Dickey–Fuller tests, cointegration analysis and vector error‑correction models to determine whether the series are linked in the long run. Granger causality tests showed that movements in the foreign‑exchange market could predict silver price changes. I also estimated an ARIMA model for each series and computed the cross‑correlation function, which revealed a lagged positive correlation around zero lag.
Predicting Share Prices with LSTM models – long‑term forecasting
Stock prices exhibit temporal dependencies and nonlinear patterns. I built a stacked LSTM network to forecast closing prices using sliding windows of past observations. The LSTM cell computes gating signals: \[ f_t = \sigma(W_f x_t + U_f h_{t-1} + b_f),\quad i_t = \sigma(W_i x_t + U_i h_{t-1} + b_i),\quad o_t = \sigma(W_o x_t + U_o h_{t-1} + b_o), \] with memory state \(c_t = f_t \odot c_{t-1} + i_t \odot \tilde{c}_t\). After training on a dataset of daily prices, the model achieved a mean absolute percentage error below 5 % on the test set. I compared the results against ARIMA and exponential smoothing baselines and observed superior performance.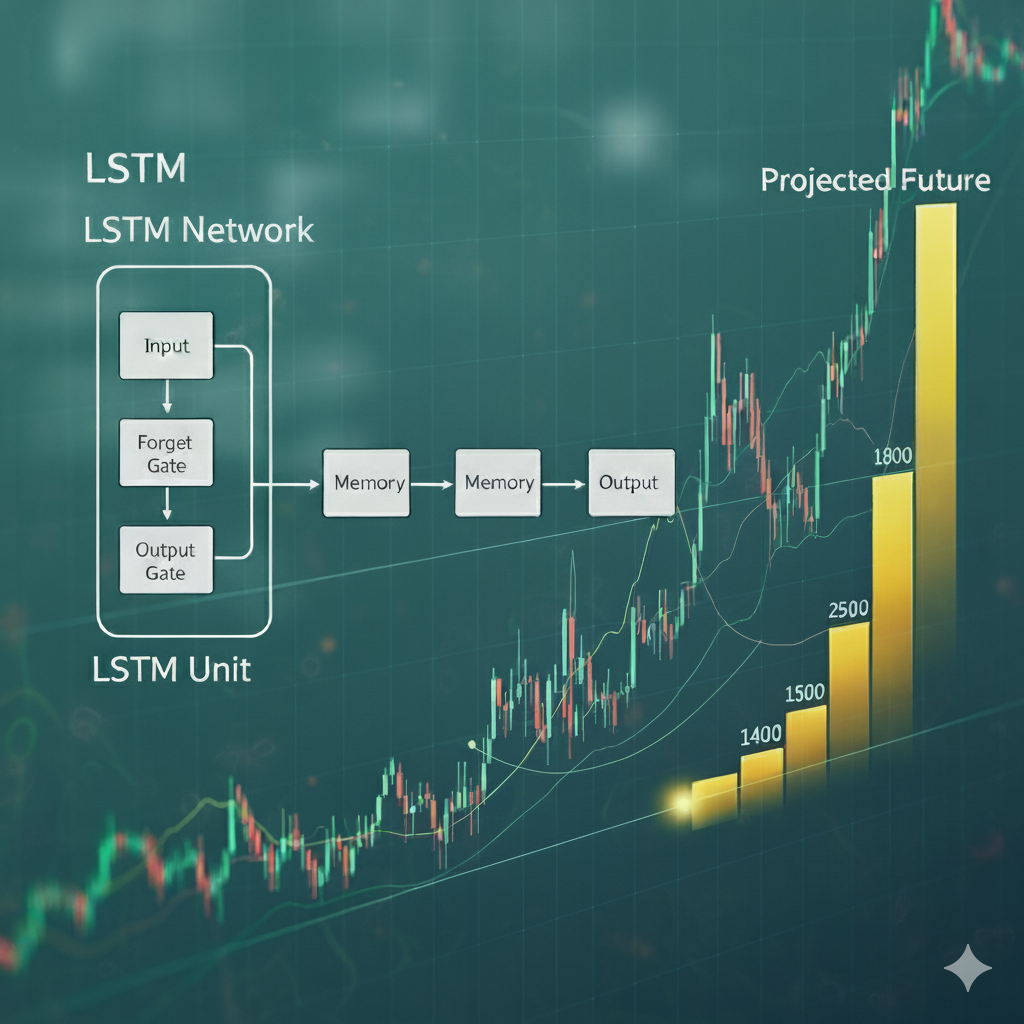
Algorithm design projects
Enhancing Drug Selectivity via Fragment-Based Design: A Scoring Algorithm Project
In a consulting role, I developed a novel scoring function for fragment-based drug design (FBDD) to enhance compound selectivity. I designed and benchmarked algorithms to rank fragment pattern similarity by integrating geometric fit (RMSD), binding free energy, and other physicochemical properties. The scoring function took the form of a weighted sum of these components: \[ S_{total} = w_{geom}S_{geom} + w_{energy}\Delta G_{bind} + w_{chem}S_{chem}, \] where (S) represents the component scores and (w) their respective weights. The resulting methodology provided a robust framework for identifying likely off-target interactions, a critical step in de-risking drug candidates.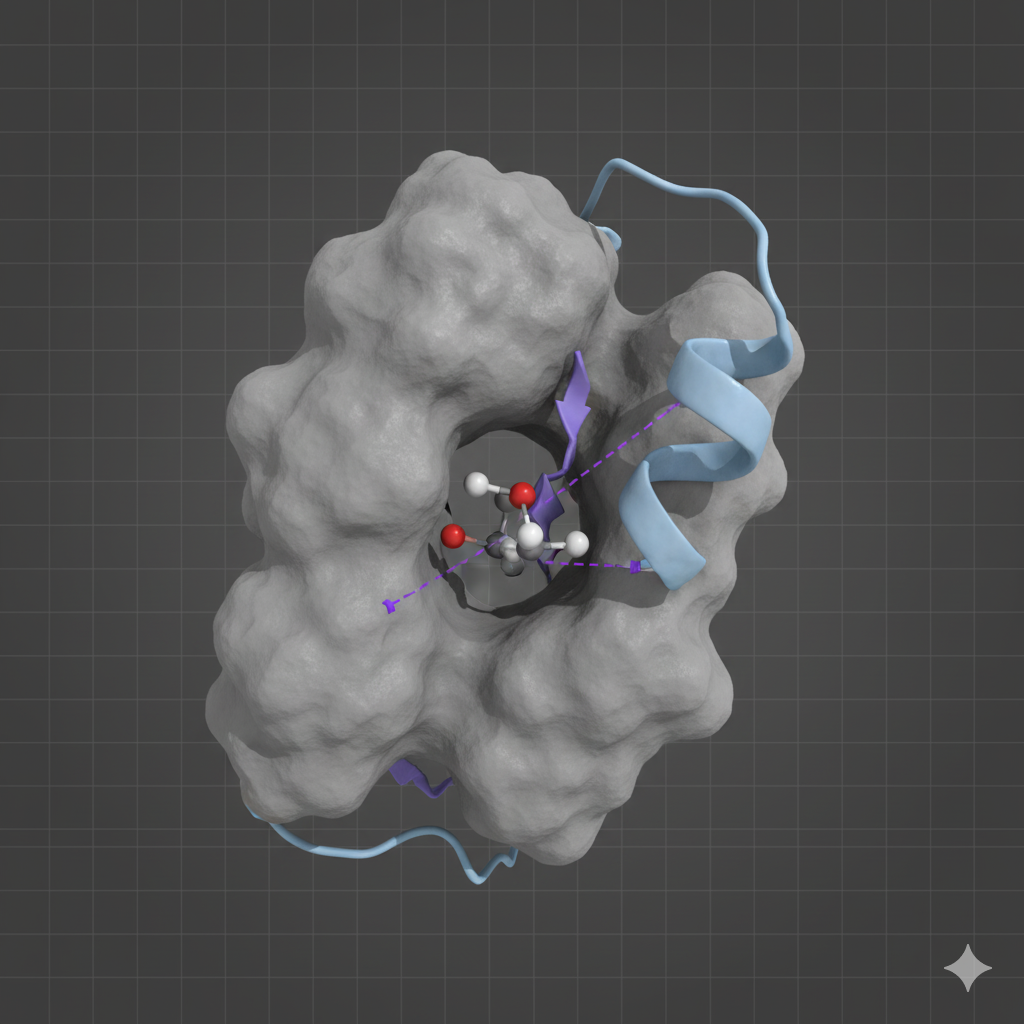
No public repository available
Big Mac Index Predictability: A Statistical Analysis – testing purchasing power parity
The Big Mac Index is often used to gauge exchange‑rate misalignment. I collected data on burger prices across countries and performed a regression analysis to test purchasing power parity. The fitted model took the form \[ \text{Price}_{\text{local}} = \beta_0 + \beta_1 \times \text{Price}_{\text{US}} + \varepsilon, \] with \(\varepsilon\) representing random error. Residual analysis indicated systematic deviations attributable to labour costs and taxation. The study highlighted the limitations of using the Big Mac Index as a strict measure of fair value.
Statistical Analysis of Sleep Deprivation in Saudi Arabia – assessing health impacts
This cross‑sectional study examined the prevalence of sleep deprivation and its association with lifestyle factors. I used t‑tests and ANOVA to compare sleep duration across demographic groups and fitted a logistic regression model to estimate the odds ratio of chronic sleep deprivation: \[ \log\frac{P(\text{deprived})}{1 - P(\text{deprived})} = \alpha + \beta_1 \times \text{screen time} + \beta_2 \times \text{coffee intake} + \dots. \] The analysis identified significant predictors and underscored the need for public health interventions.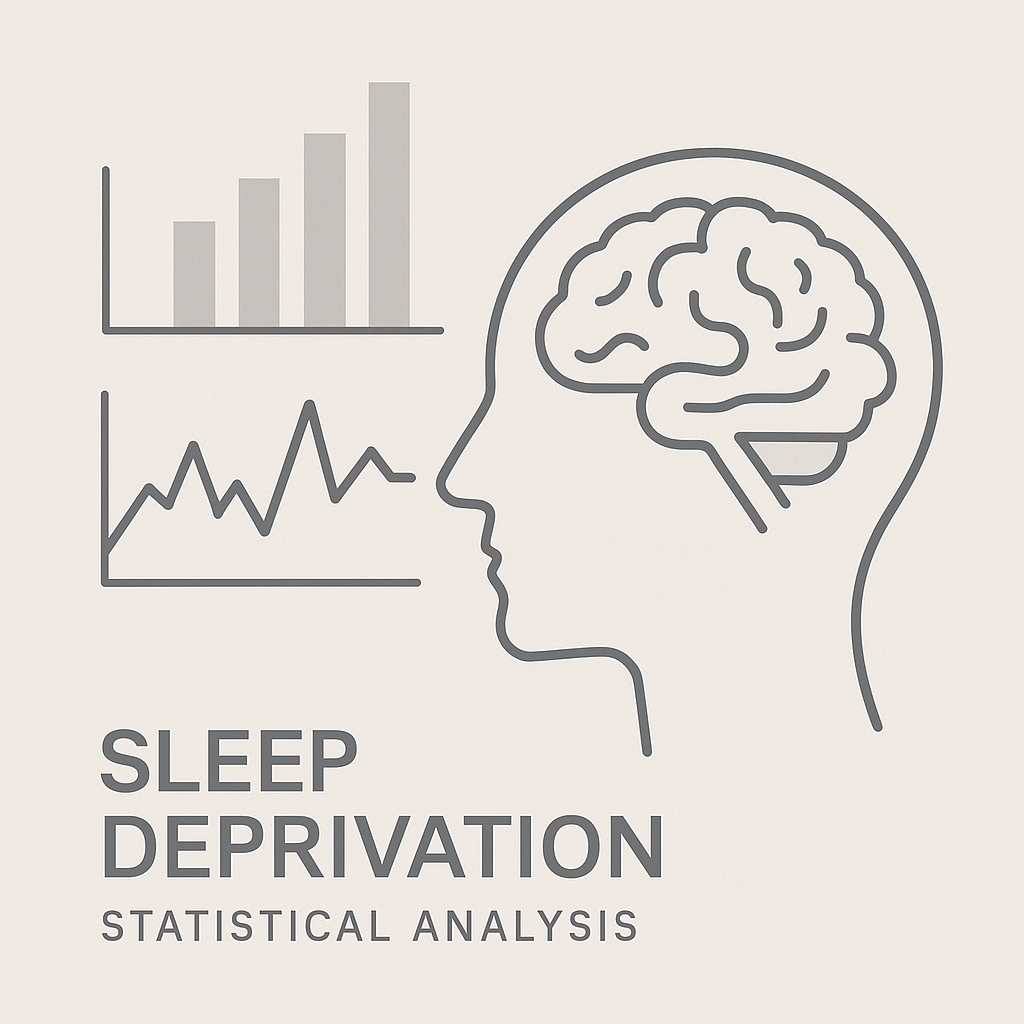
No public repository available
Dynamic Risk Assessment in Cybersecurity – modelling evolving threats
This project models cyber risk in banking systems using Bayesian Attack Graphs (BAGs) and the A\* search algorithm. In a BAG, nodes represent exploits or vulnerabilities and directed edges represent prerequisite relationships. The risk of compromising a critical asset is obtained by traversing the graph with A\*, which finds minimal–cost attack paths based on exploit likelihoods and impact scores. Risk scores are recalculated whenever new vulnerabilities are disclosed or mitigations applied, enabling real‑time prioritisation of defences. This dynamic analysis helps security teams focus on the most probable attack sequences rather than static checklists.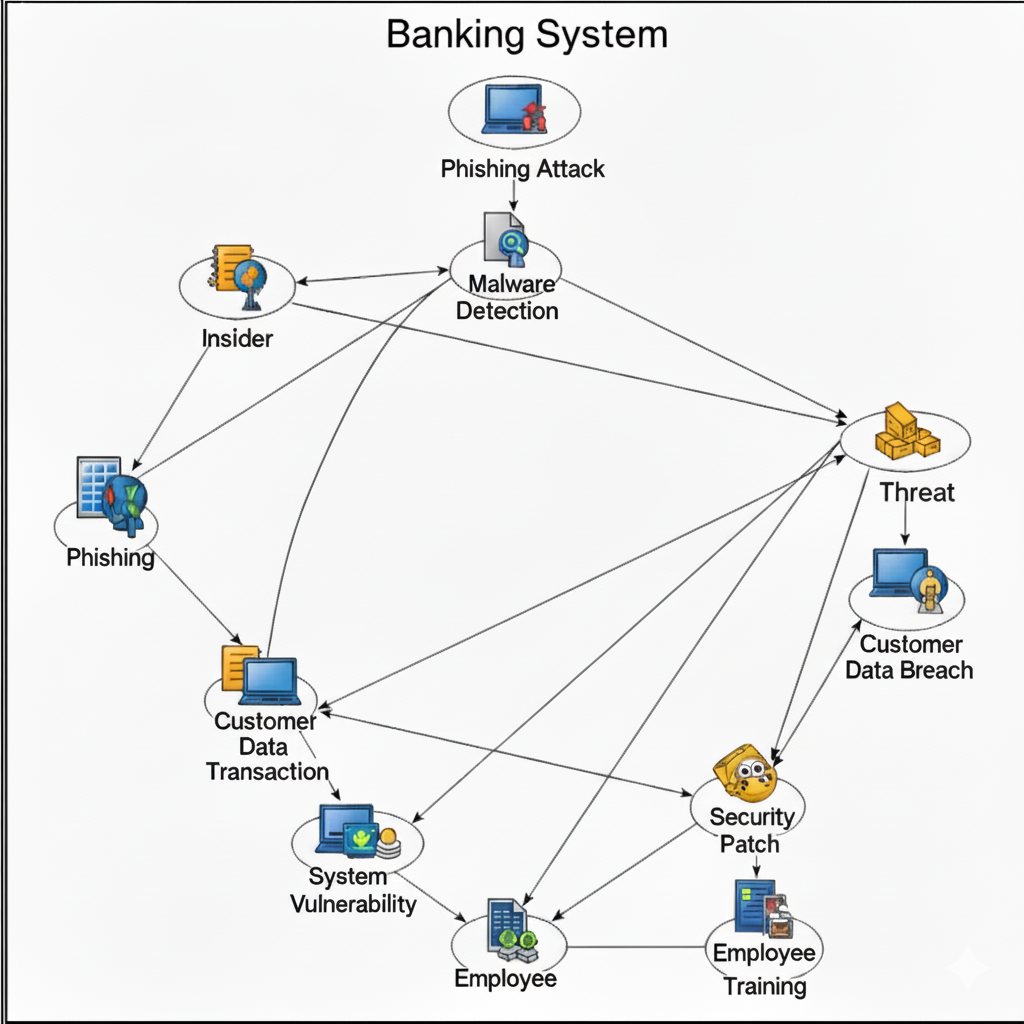
Cybersecurity Risk Assessment in Banking Systems – quantifying exposure
For a banking client I built a machine‑learning pipeline to detect anomalous API requests and quantify exposure. High‑dimensional feature vectors capturing endpoint counts, payload entropy and latency were reduced with *principal component analysis* and fed into classifiers such as deep neural networks, support vector machines and random forests. Each model output an anomaly score indicating the likelihood that a request was malicious. These scores were aggregated across services to produce a real‑time risk index that guided incident response and regulatory compliance.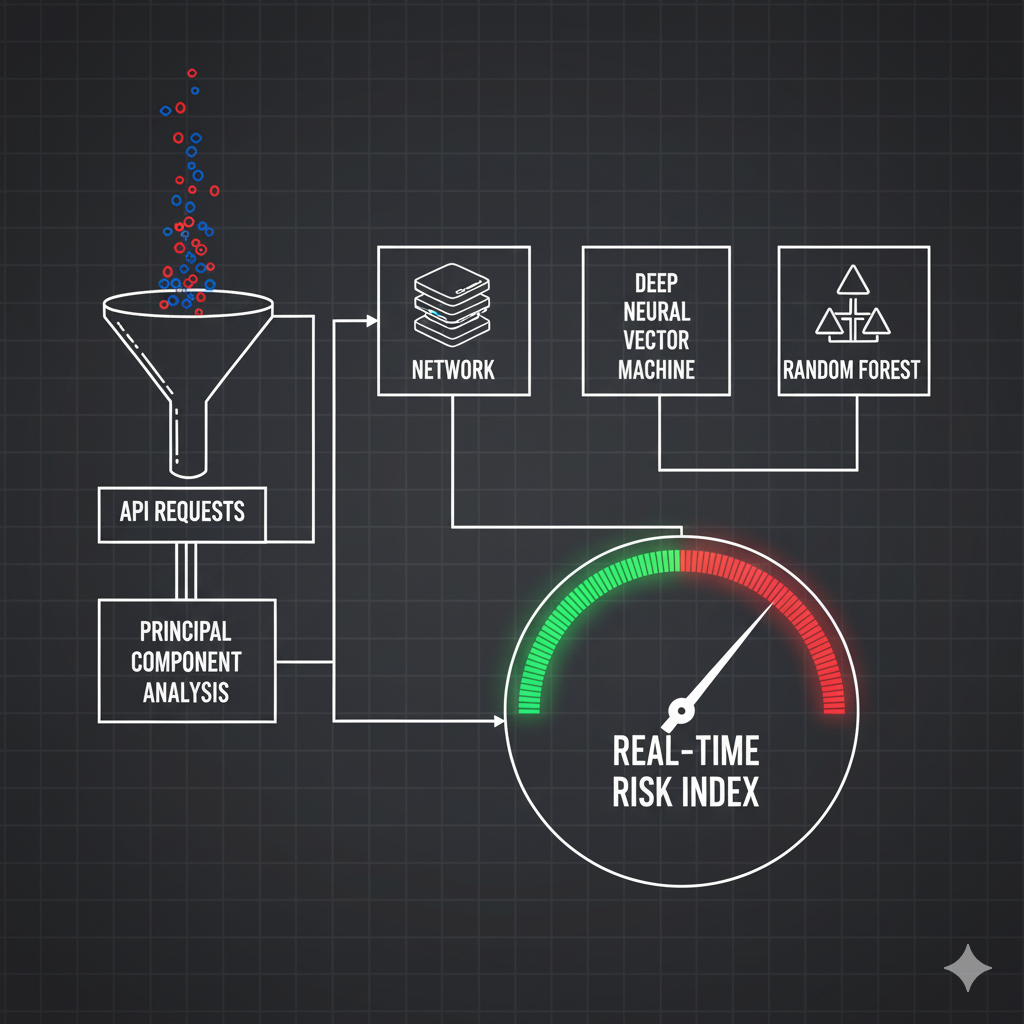
Market research projects
Market Research for a Nanosized Thermometer – evaluating potential
I conducted a market study for a nanoscale temperature sensor aimed at biomedical applications. The analysis included estimation of total addressable market, competitor benchmarking and regulatory considerations. Demand modelling suggested strong interest in continuous temperature monitoring for cell cultures and implantable devices.
Market Analysis for an Immunotherapy Platform – sizing and segmentation
This project assessed the commercial landscape for a platform enabling personalised immunotherapy manufacturing. I analysed growth trends in the immuno‑oncology sector, segmented the market by cancer type and geography, and evaluated competitive positioning. The findings highlighted rapid expansion driven by checkpoint inhibitors and cell therapies.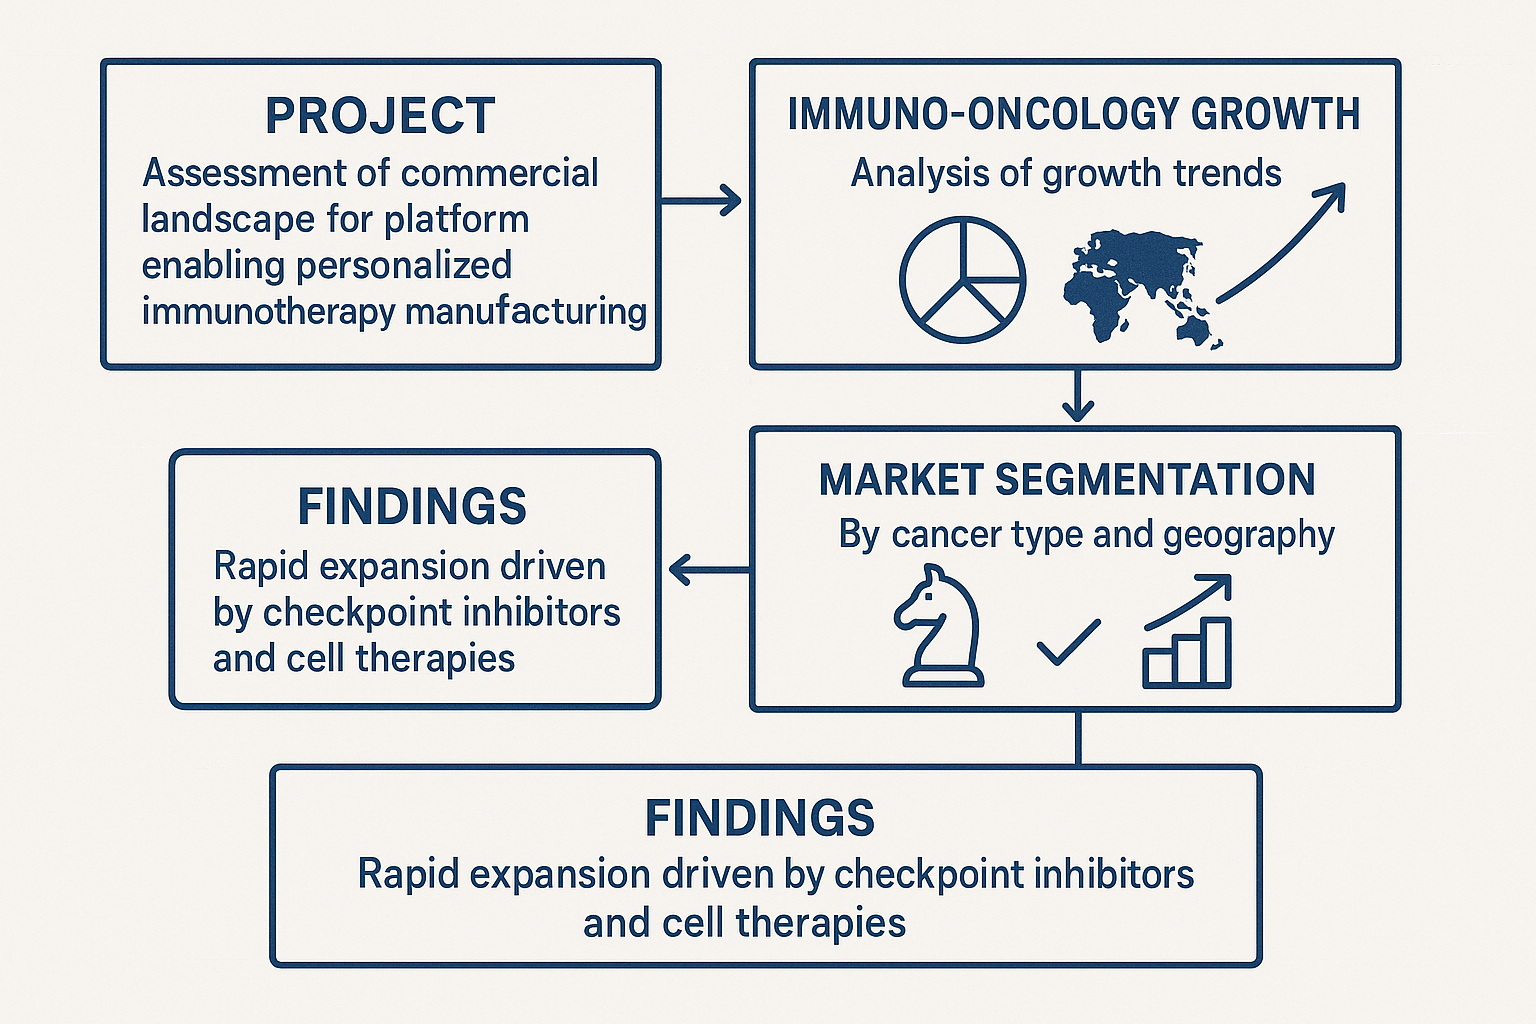
Diverse Research Contributions in Solar Energy and Carbon Capture Technologies – renewable innovations
In addition to data science consulting, I contributed to studies on photovoltaic materials and catalytic carbon capture. I analysed performance metrics of perovskite solar cells, evaluated the kinetics of CO2 adsorption on amine‑functionalised sorbents and modelled energy yields under varying illumination. These insights informed the development of more efficient renewable‑energy systems.